station selector
quick facts
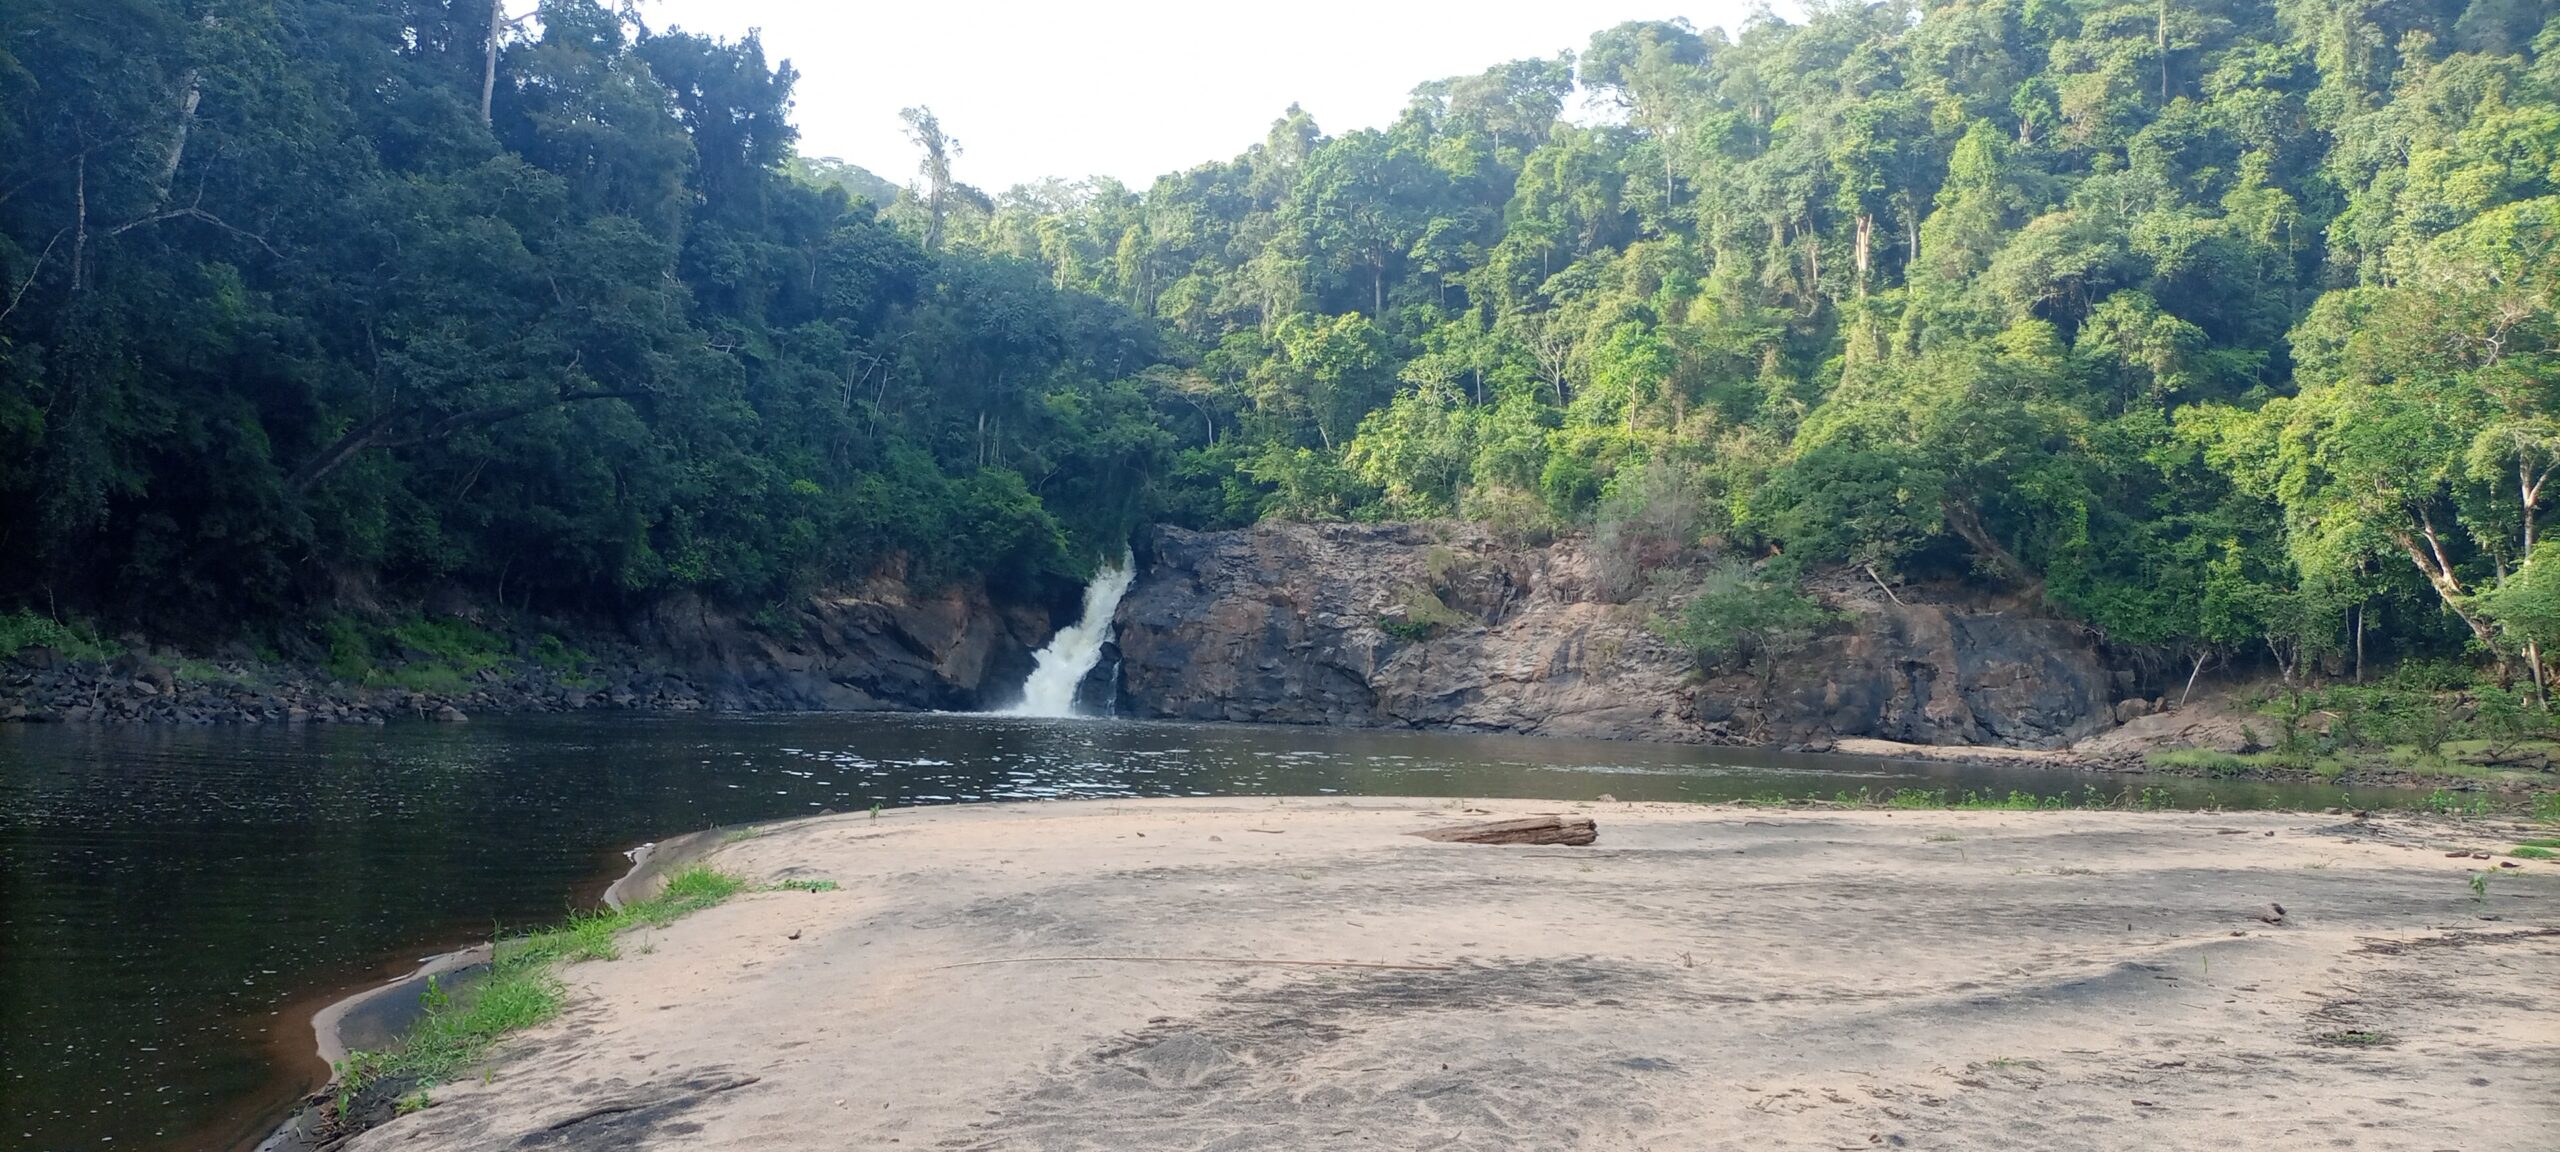
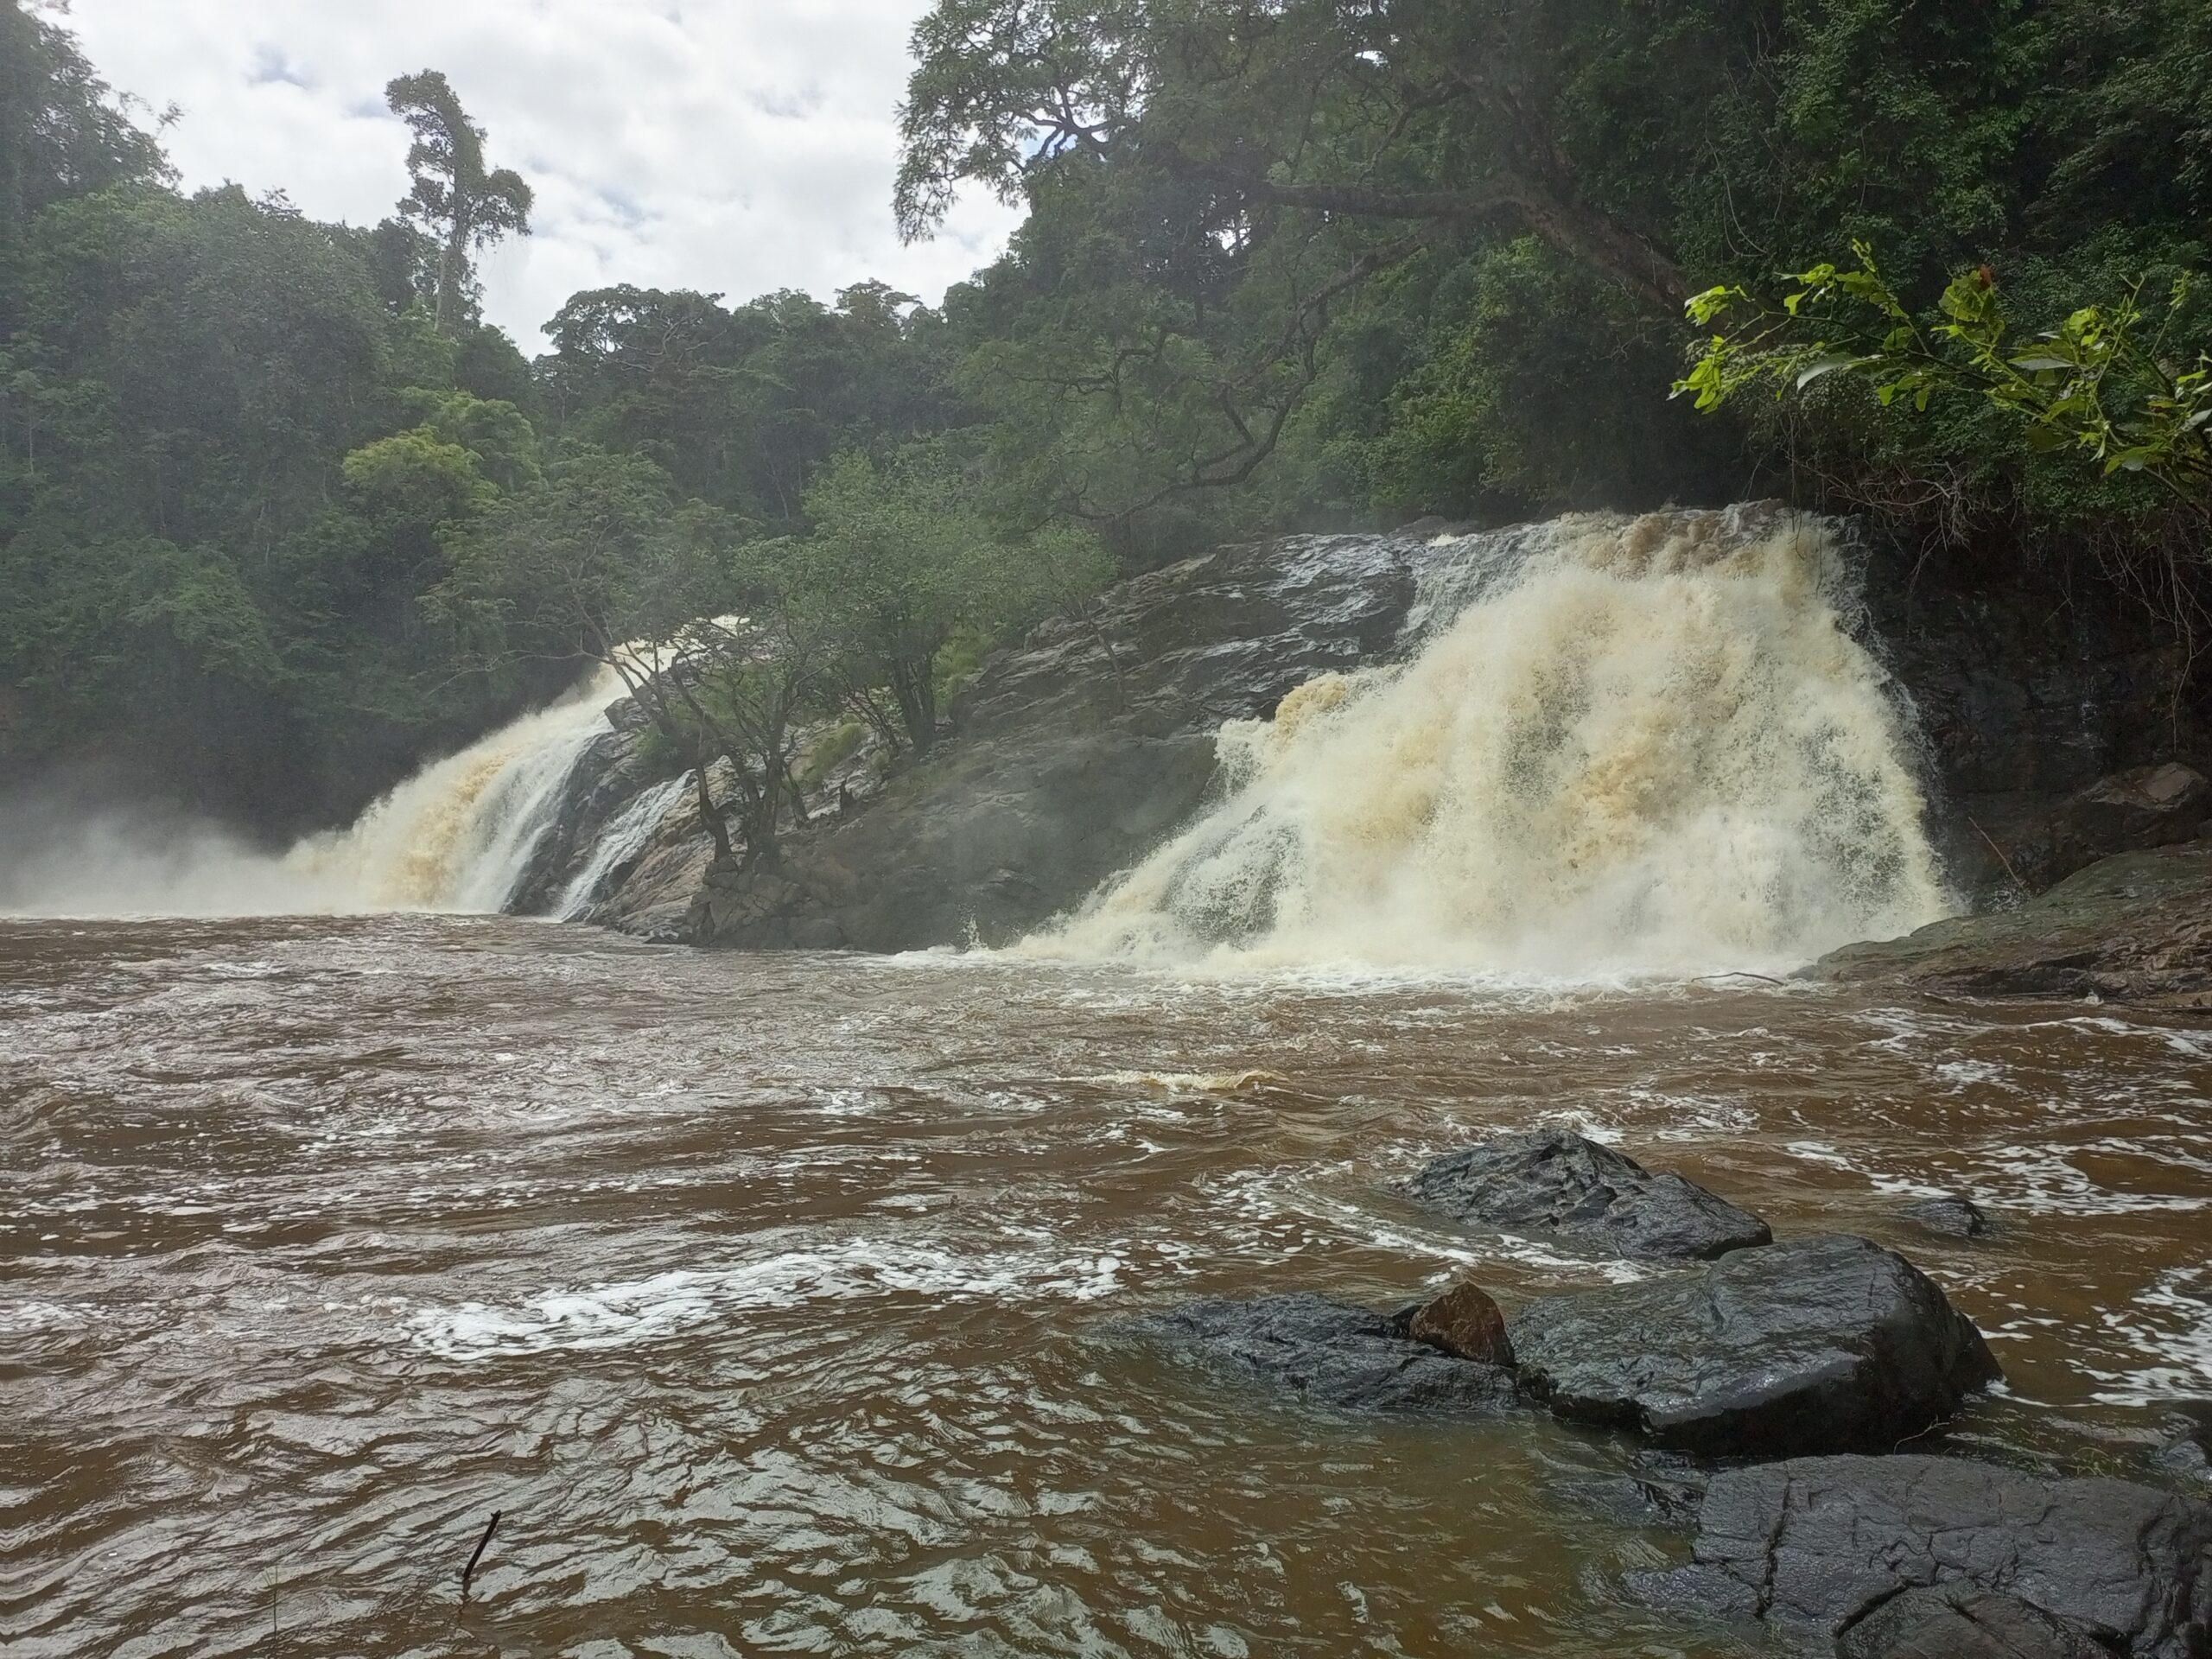
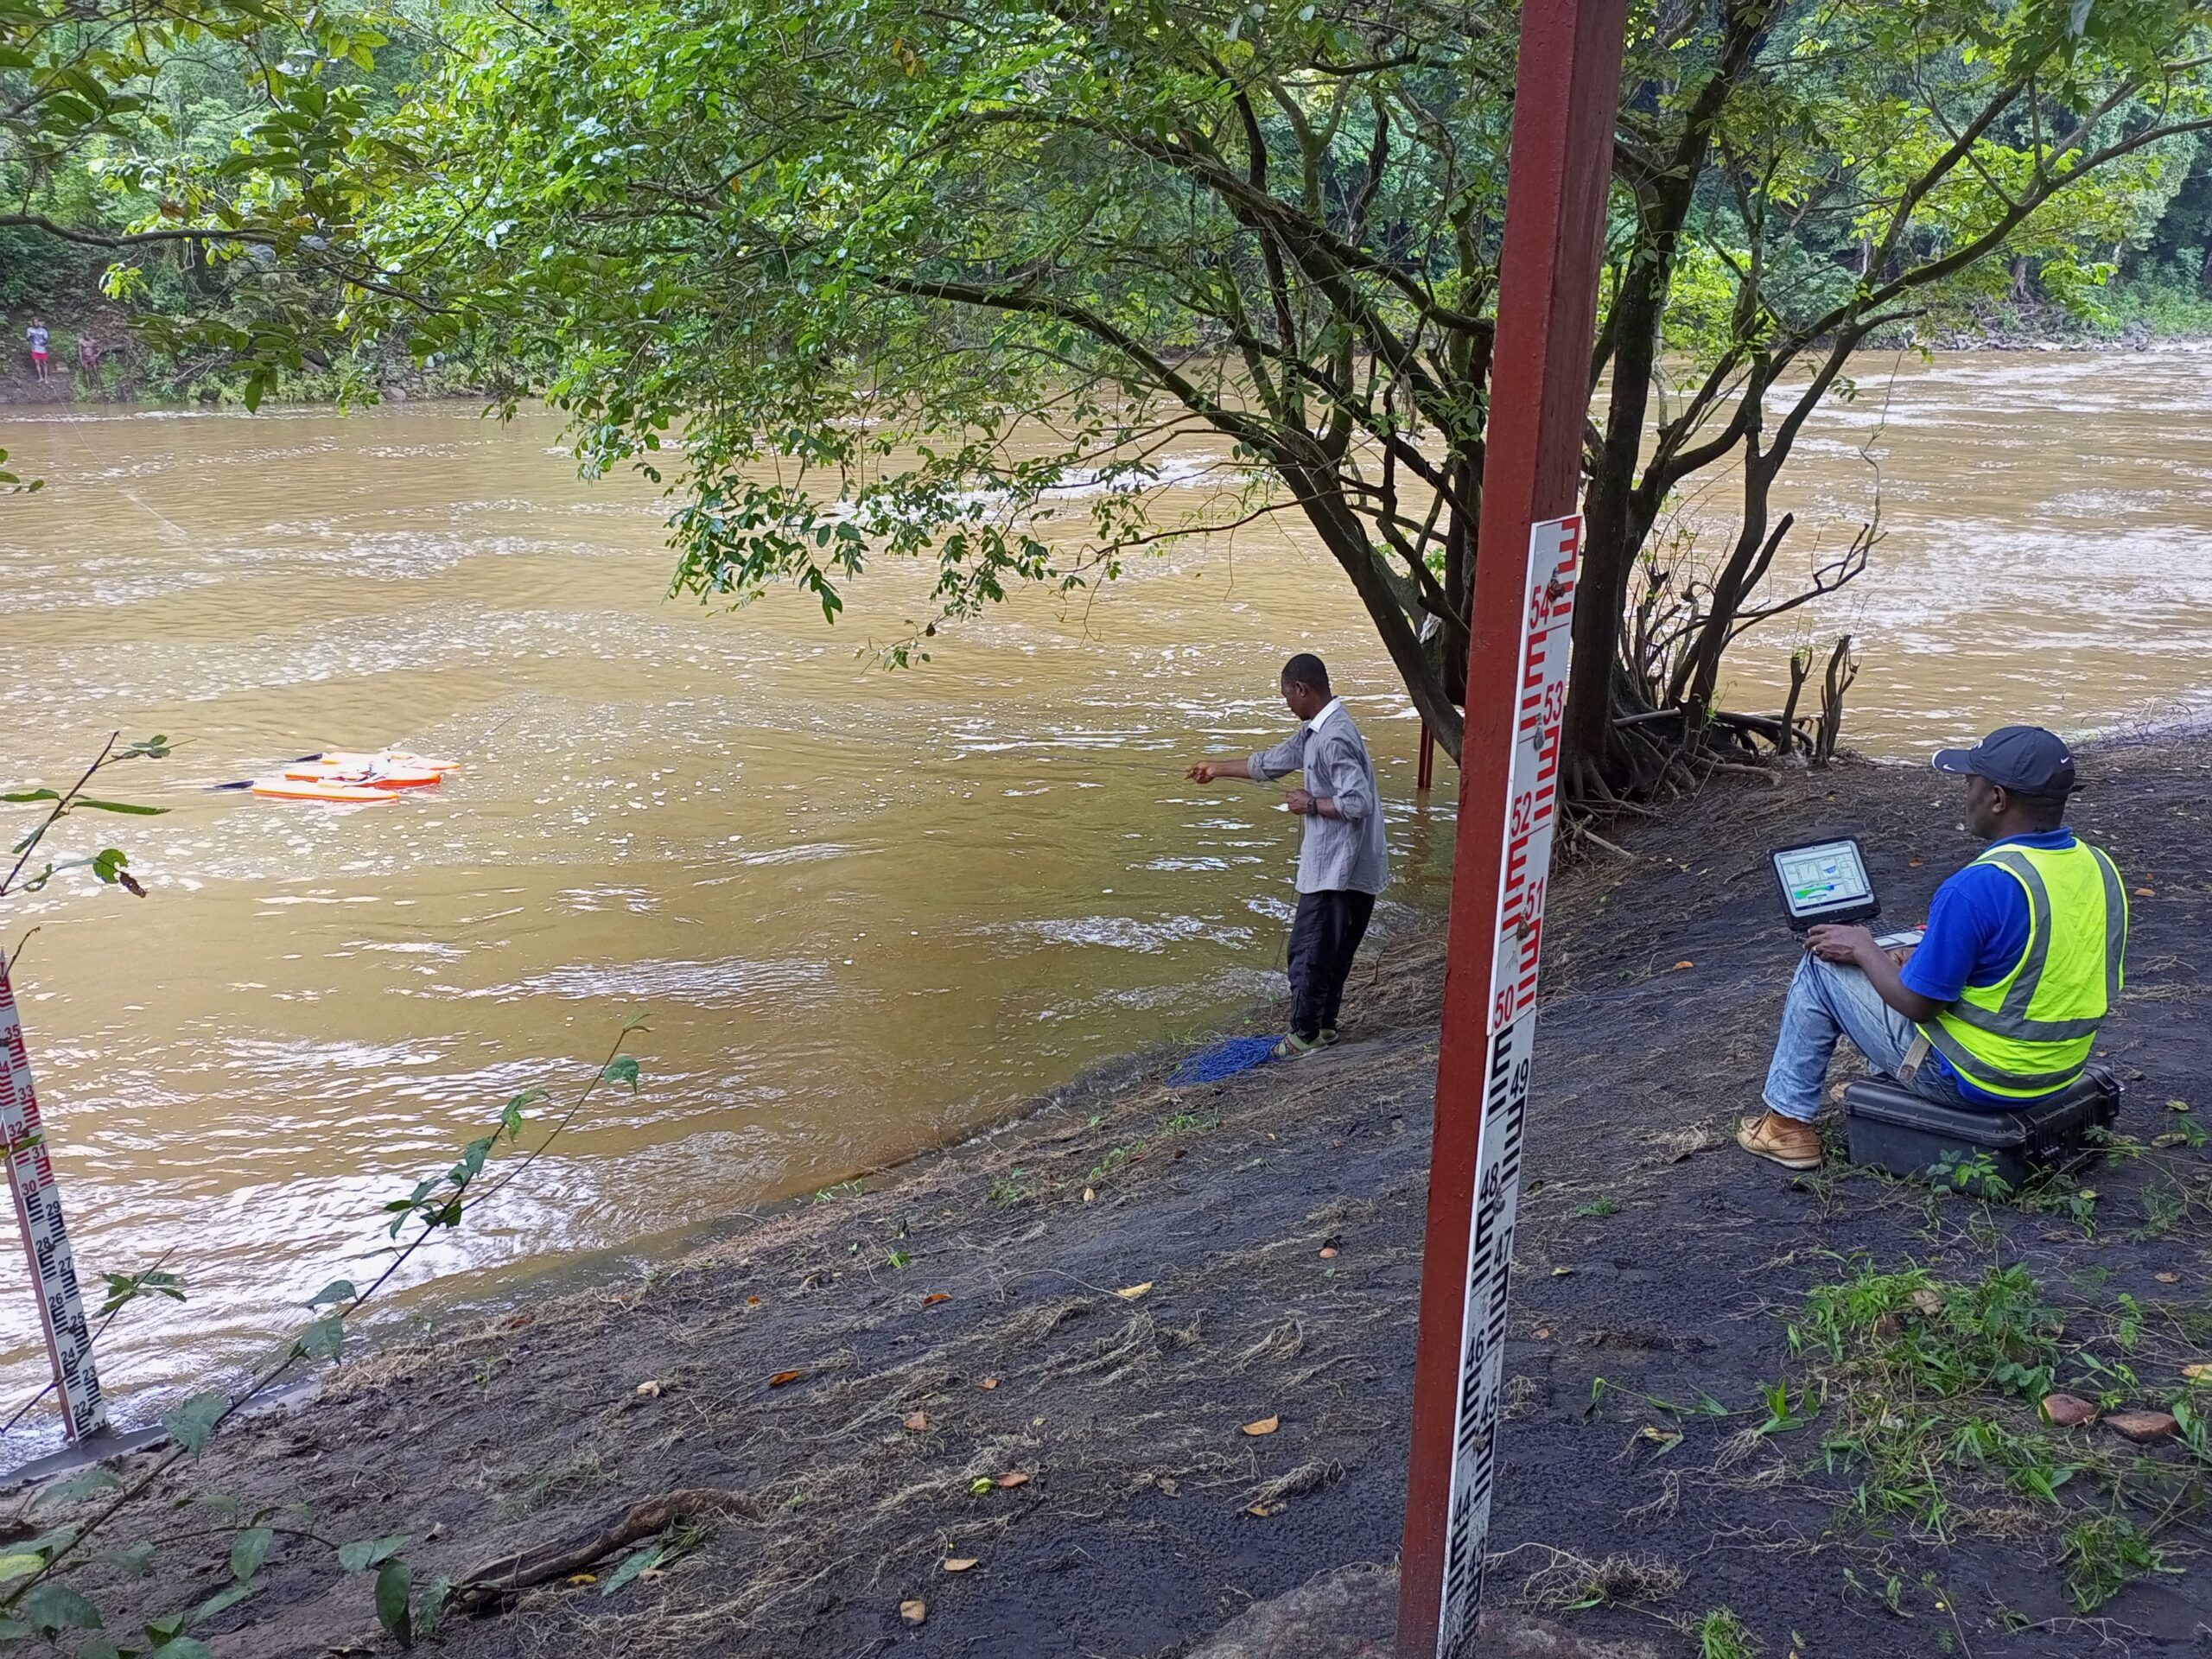
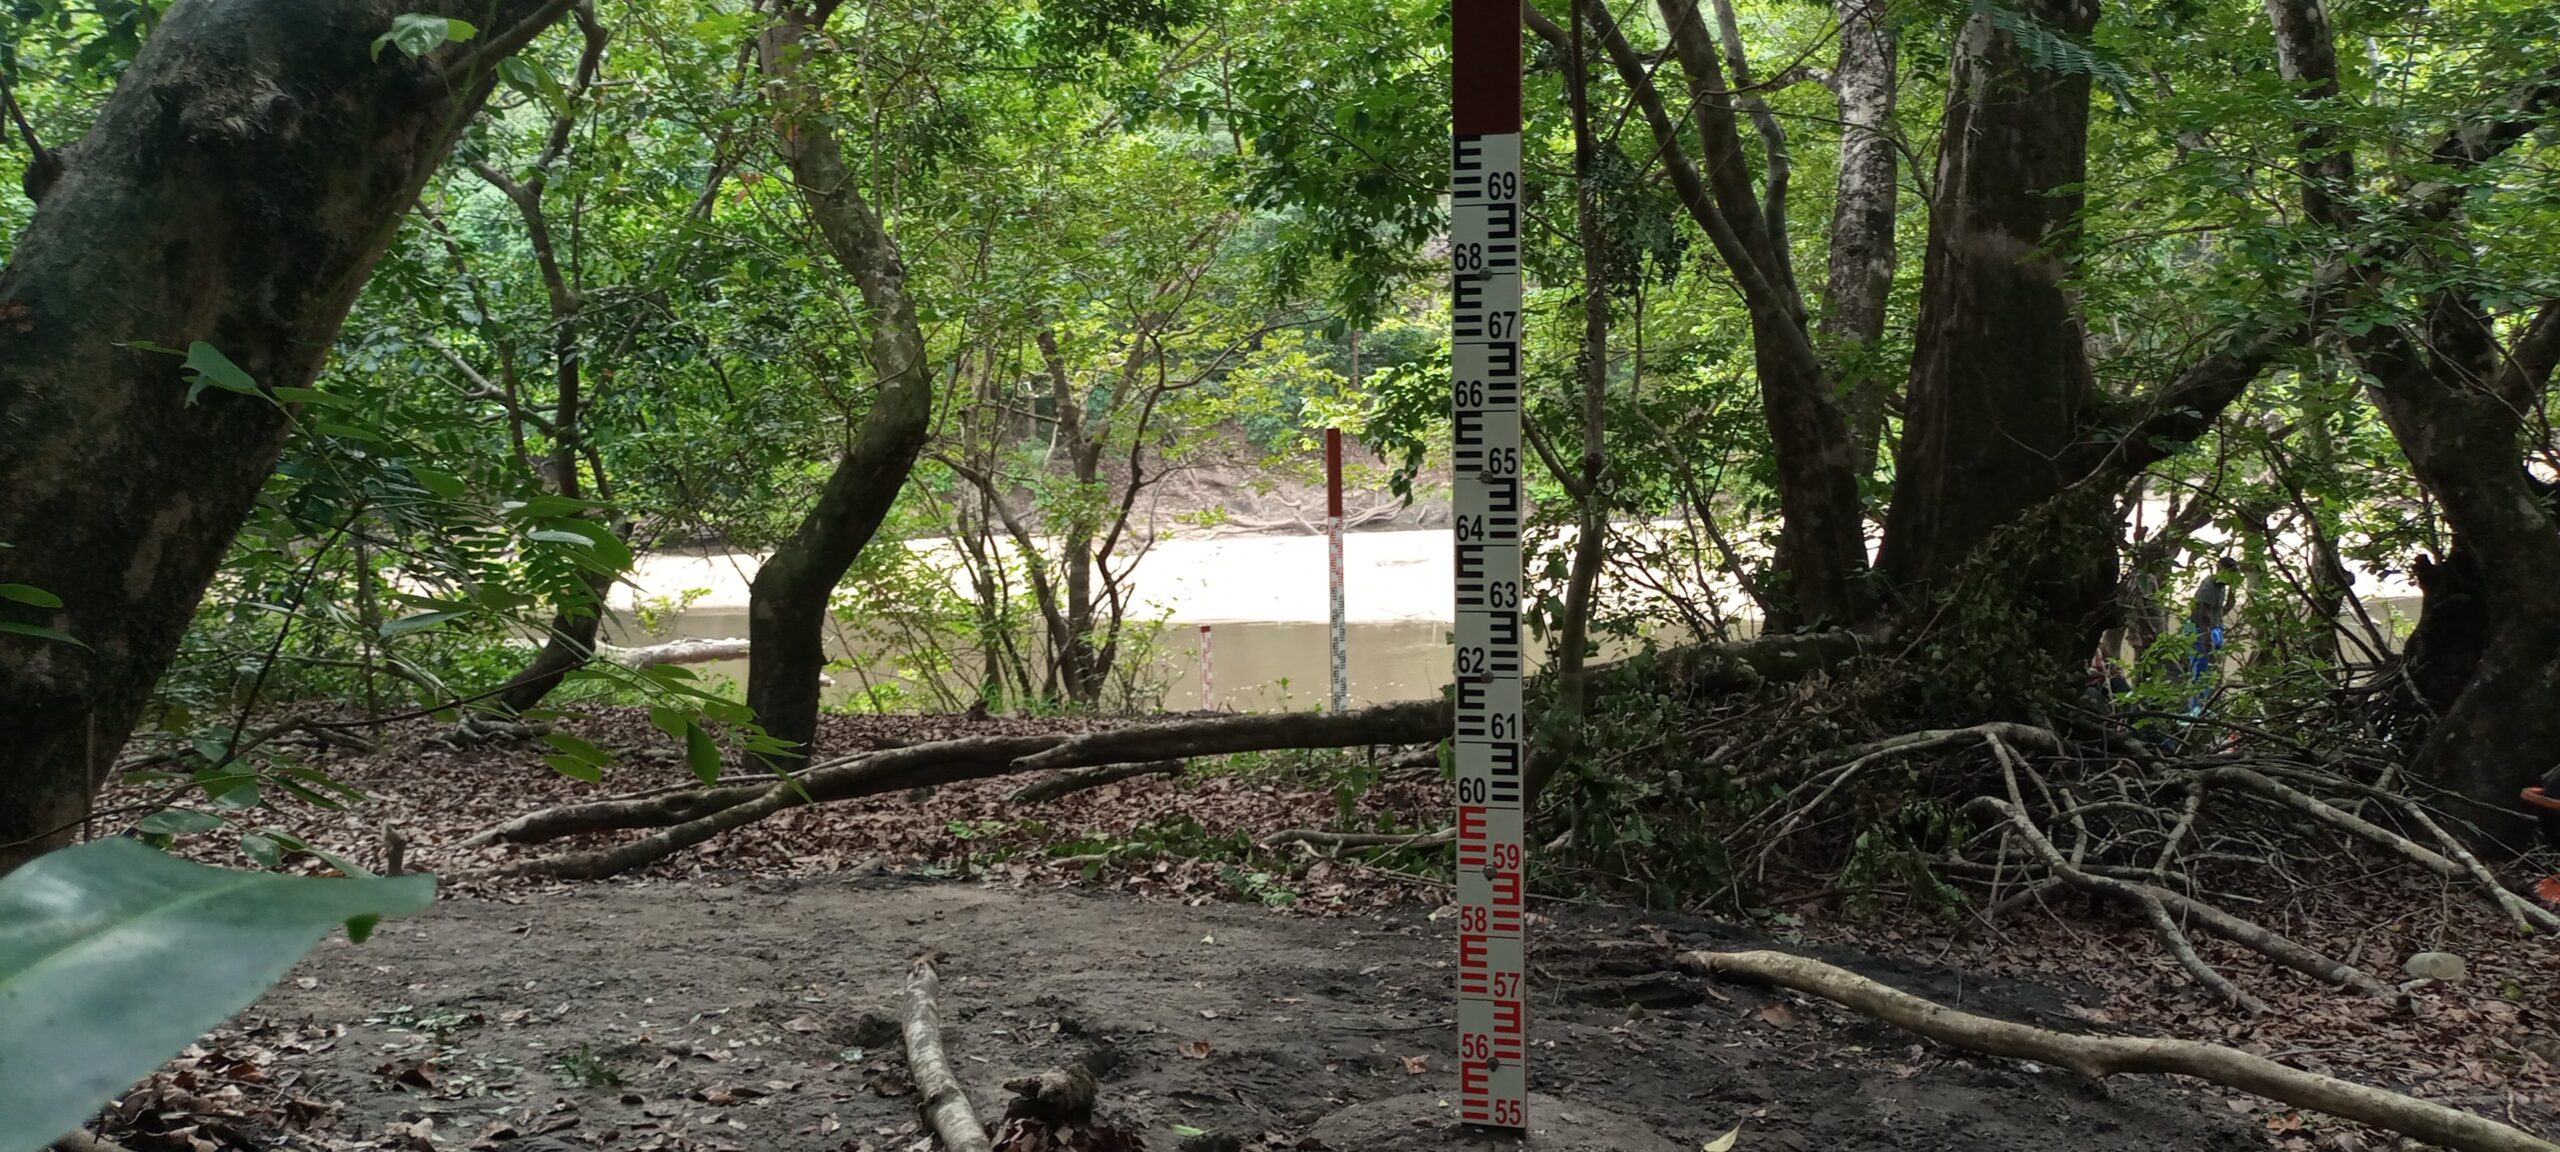
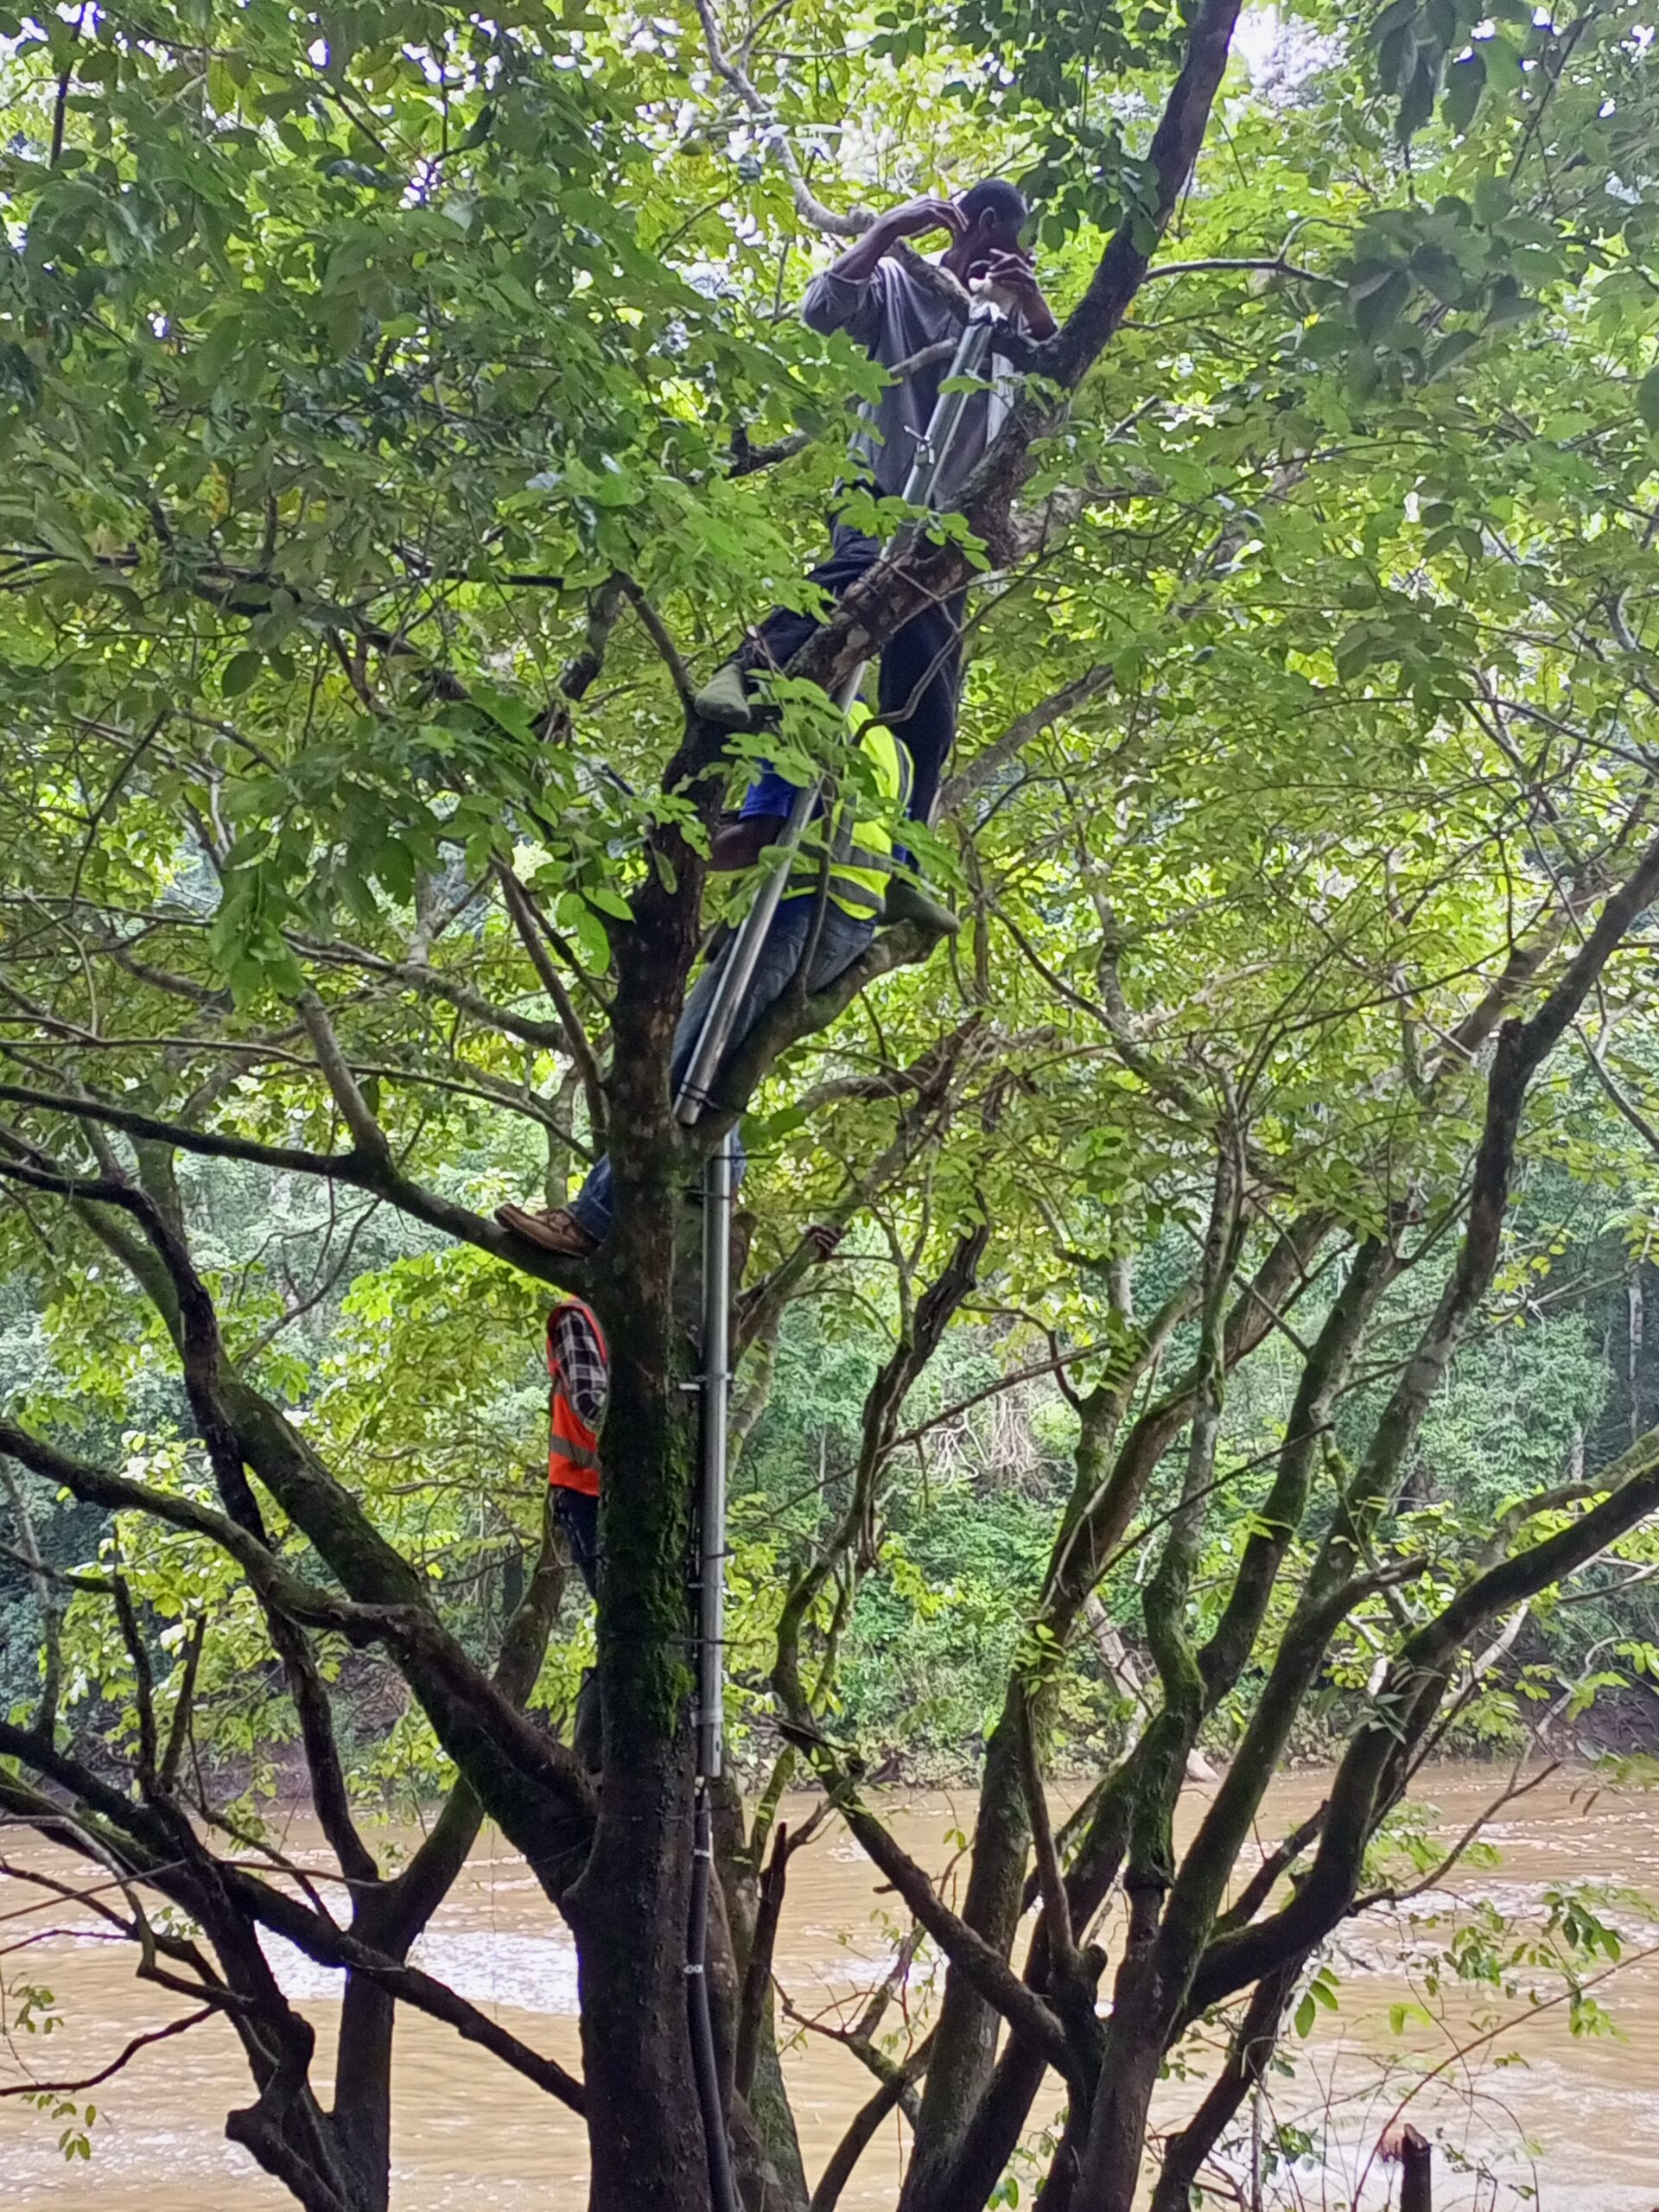
St. John River at Gbedin Fall
| Area | (---) km2 |
| Stream Length | (---) km |
| Start Date | 5/4/2022 |
| End Date | 31-08-22 |
| Mean Flow | (---) m3/s |
| Mean Annual Catchment Runoff | (----) mm |
| Mean Specific Flow | (----) l/skm2 |
| Minimum daily flow | (----) m3/s |
| Maximum daily flow | (----) m3/s |
| Water Year | May to April |
data explorer
station facts
data download
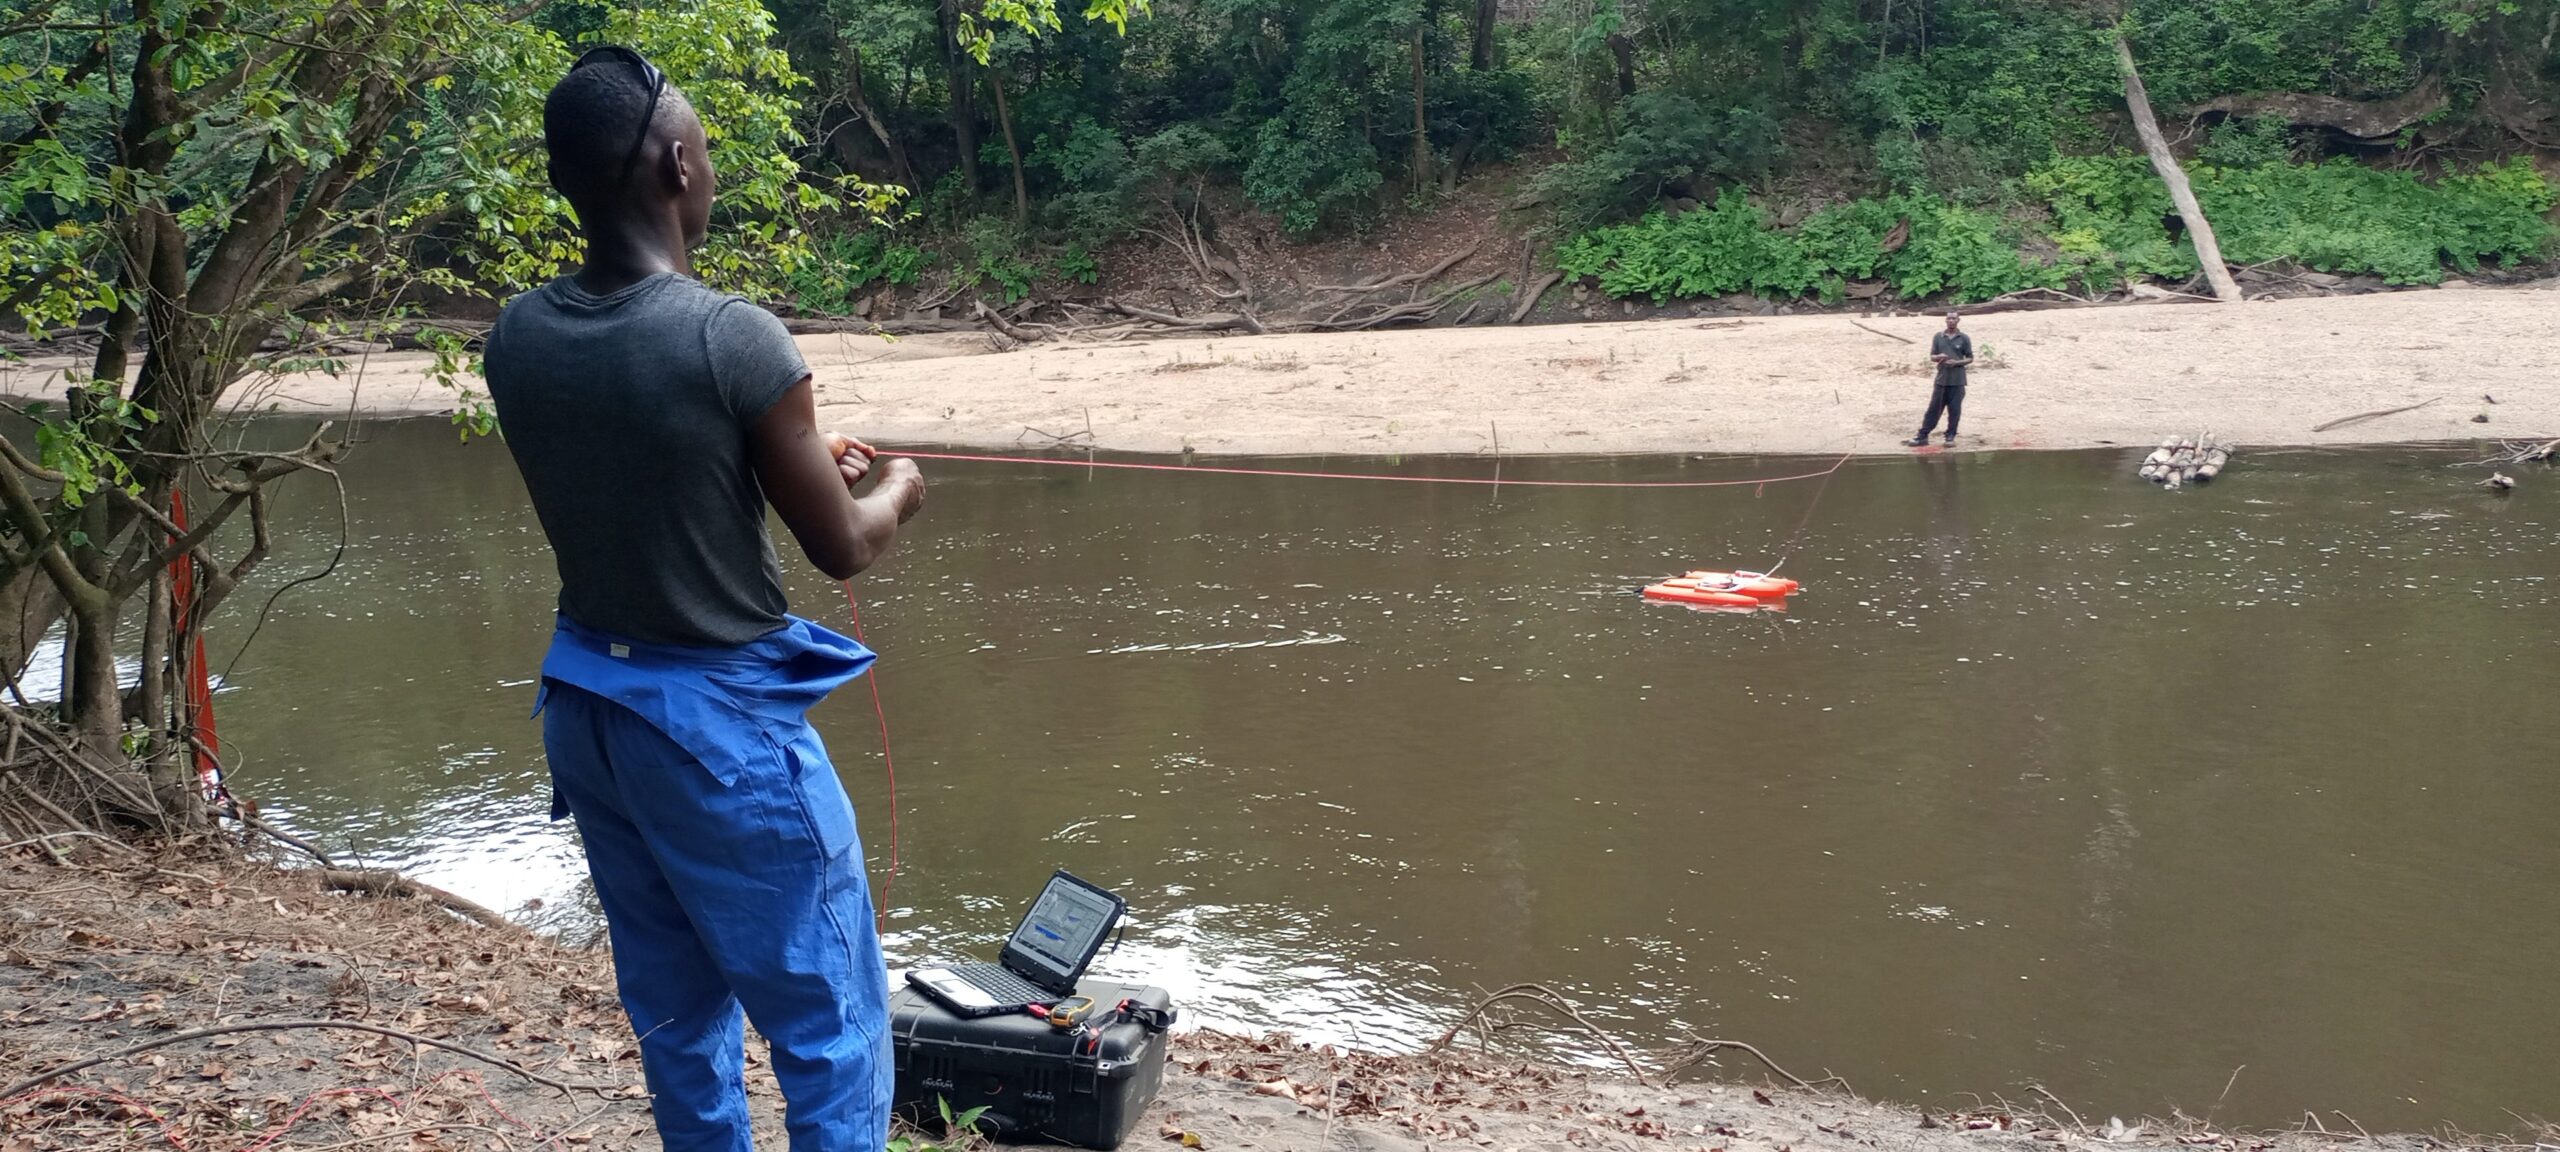
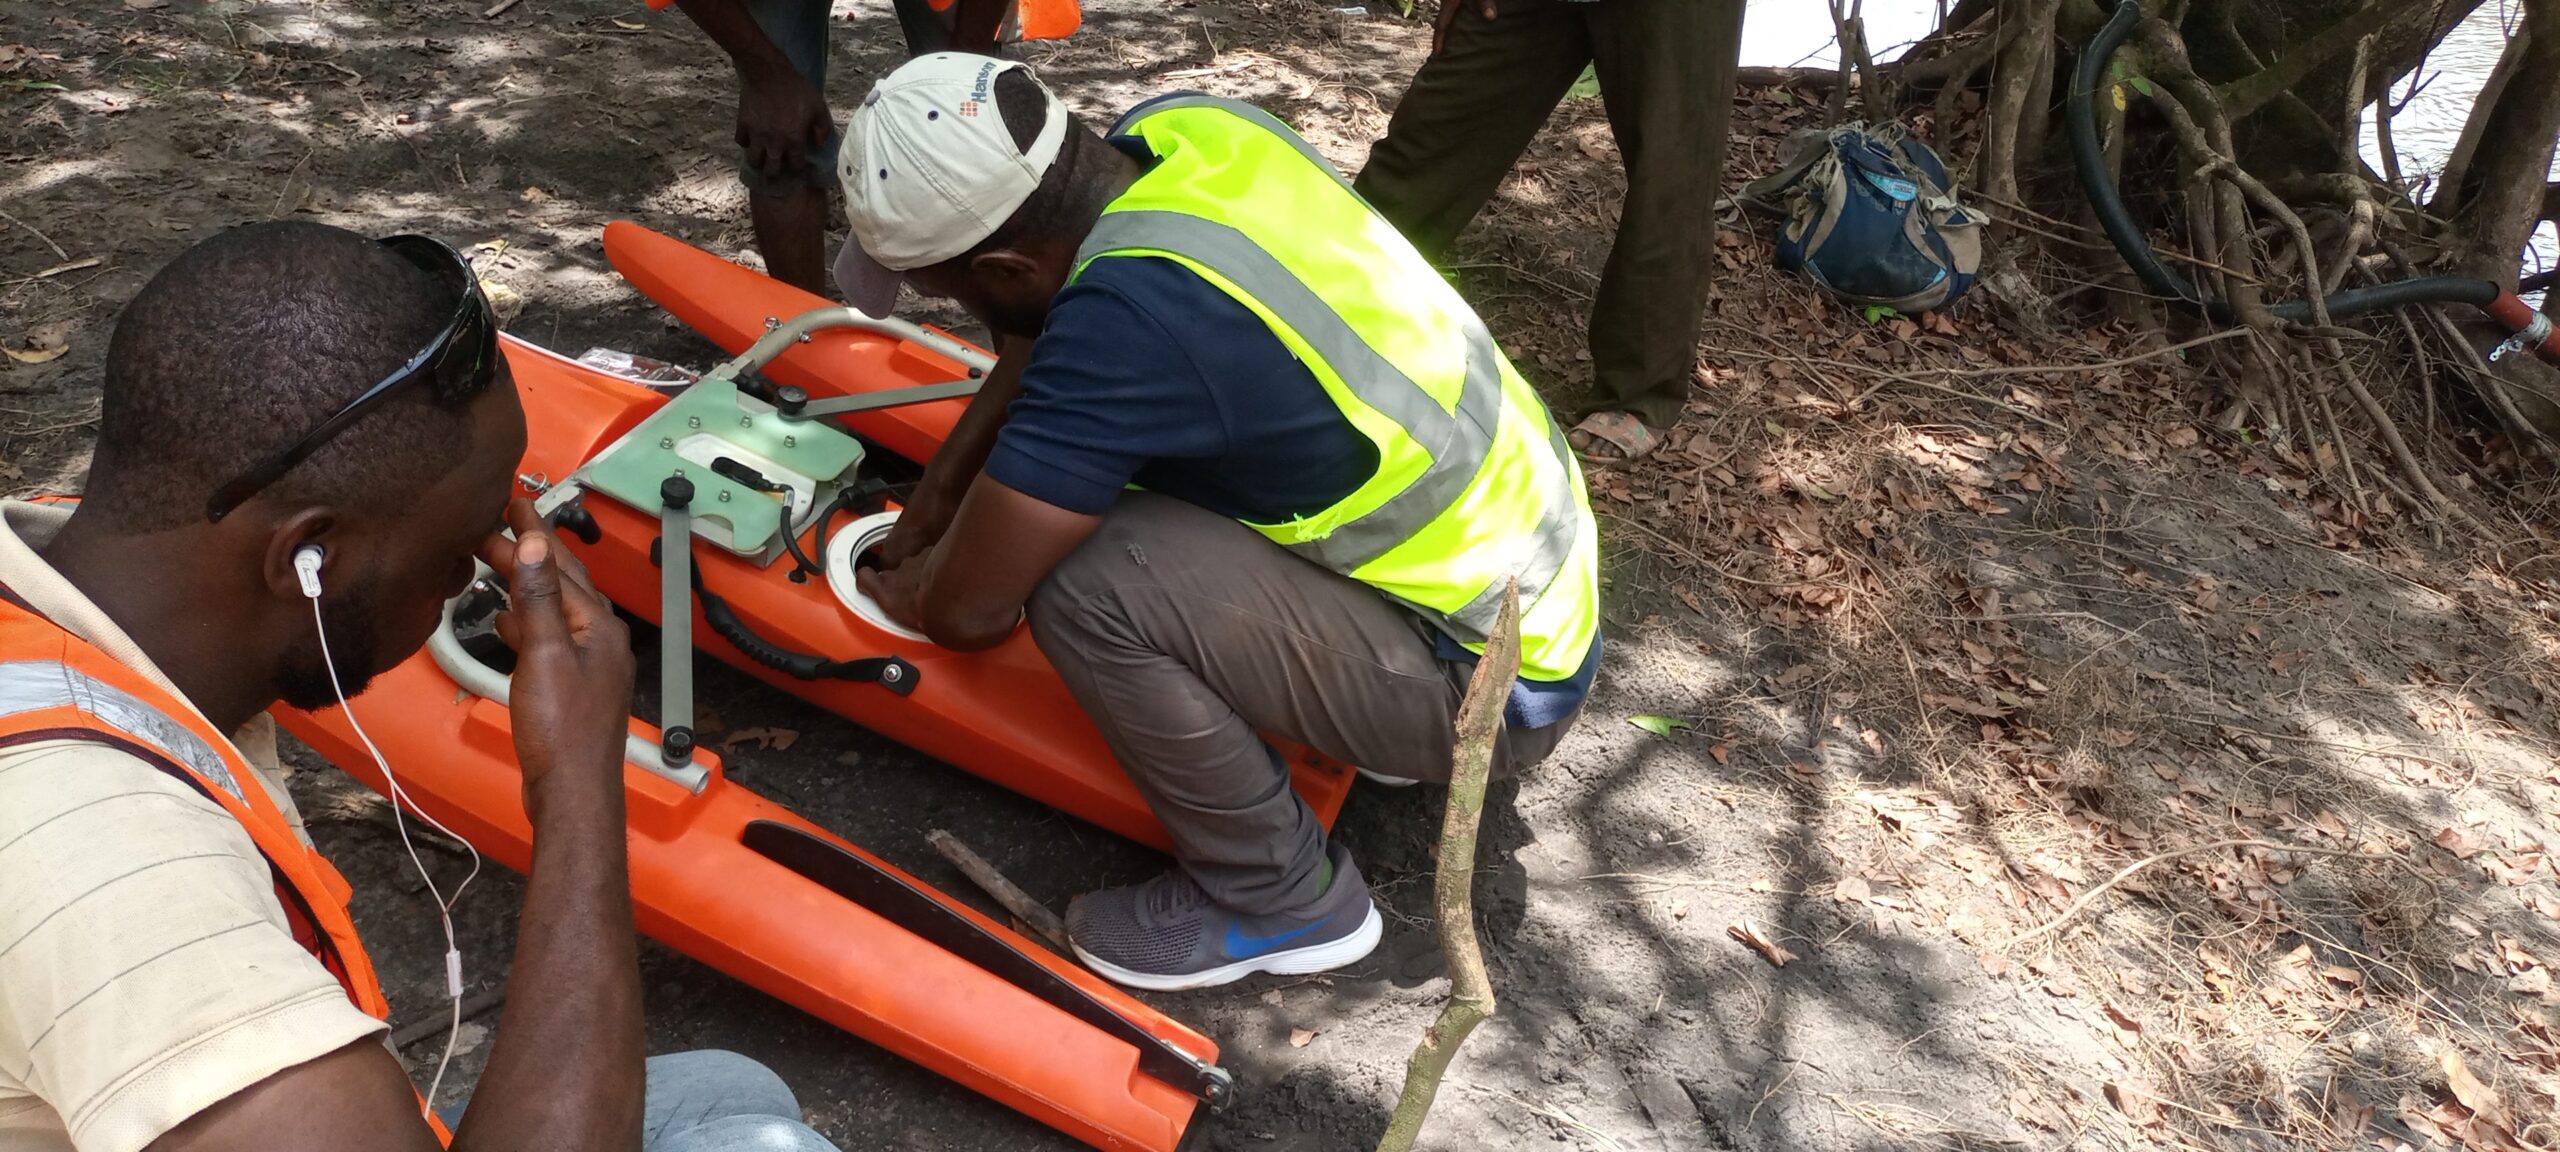
gallery
annual
monthly
daily
St. John River at Gbedin Fall
Average annual streamflow (m3/s)
(m3/s)
water year (may to april)
difference from mean annual streamflow (m3/s)
(m3/s)
water year (may to april)
mean monthly streamflow (m3/s)
(m3/s)
water year (may to april)
percentage of mean annual flow volume (%)
(%)
water year (may to april)
average daily streamflow (m3/s)
(m3/s)
daily flow duration curve (m3/s)
(m3/s)
St. John River at Gbedin Fall
| Basin | 06 Saint John |
| River | Saint John |
| Station | Gbedin Fall |
| LHS ID | 06SJ004 |
| Location | 8.84318 °N 7.33234 °W |
| Gauge | Manual staff gauge, from 05.04.2022 additional OTT Orpheus Mini pressure sensor |
| Area | (---) km2 |
| Stream Length | (---) km |
| Max elevation | (---) m |
| Min elevation | (---)m |
| Start Date | 5/4/2022 |
| End Date | 31-08-22 |
| Mean Annual Catchment Runoff | (----) mm |
| Mean Specific Flow | (----) l/skm2 |
| Water Year | May to April |
To download data please fill in the fields below