station selector
quick facts
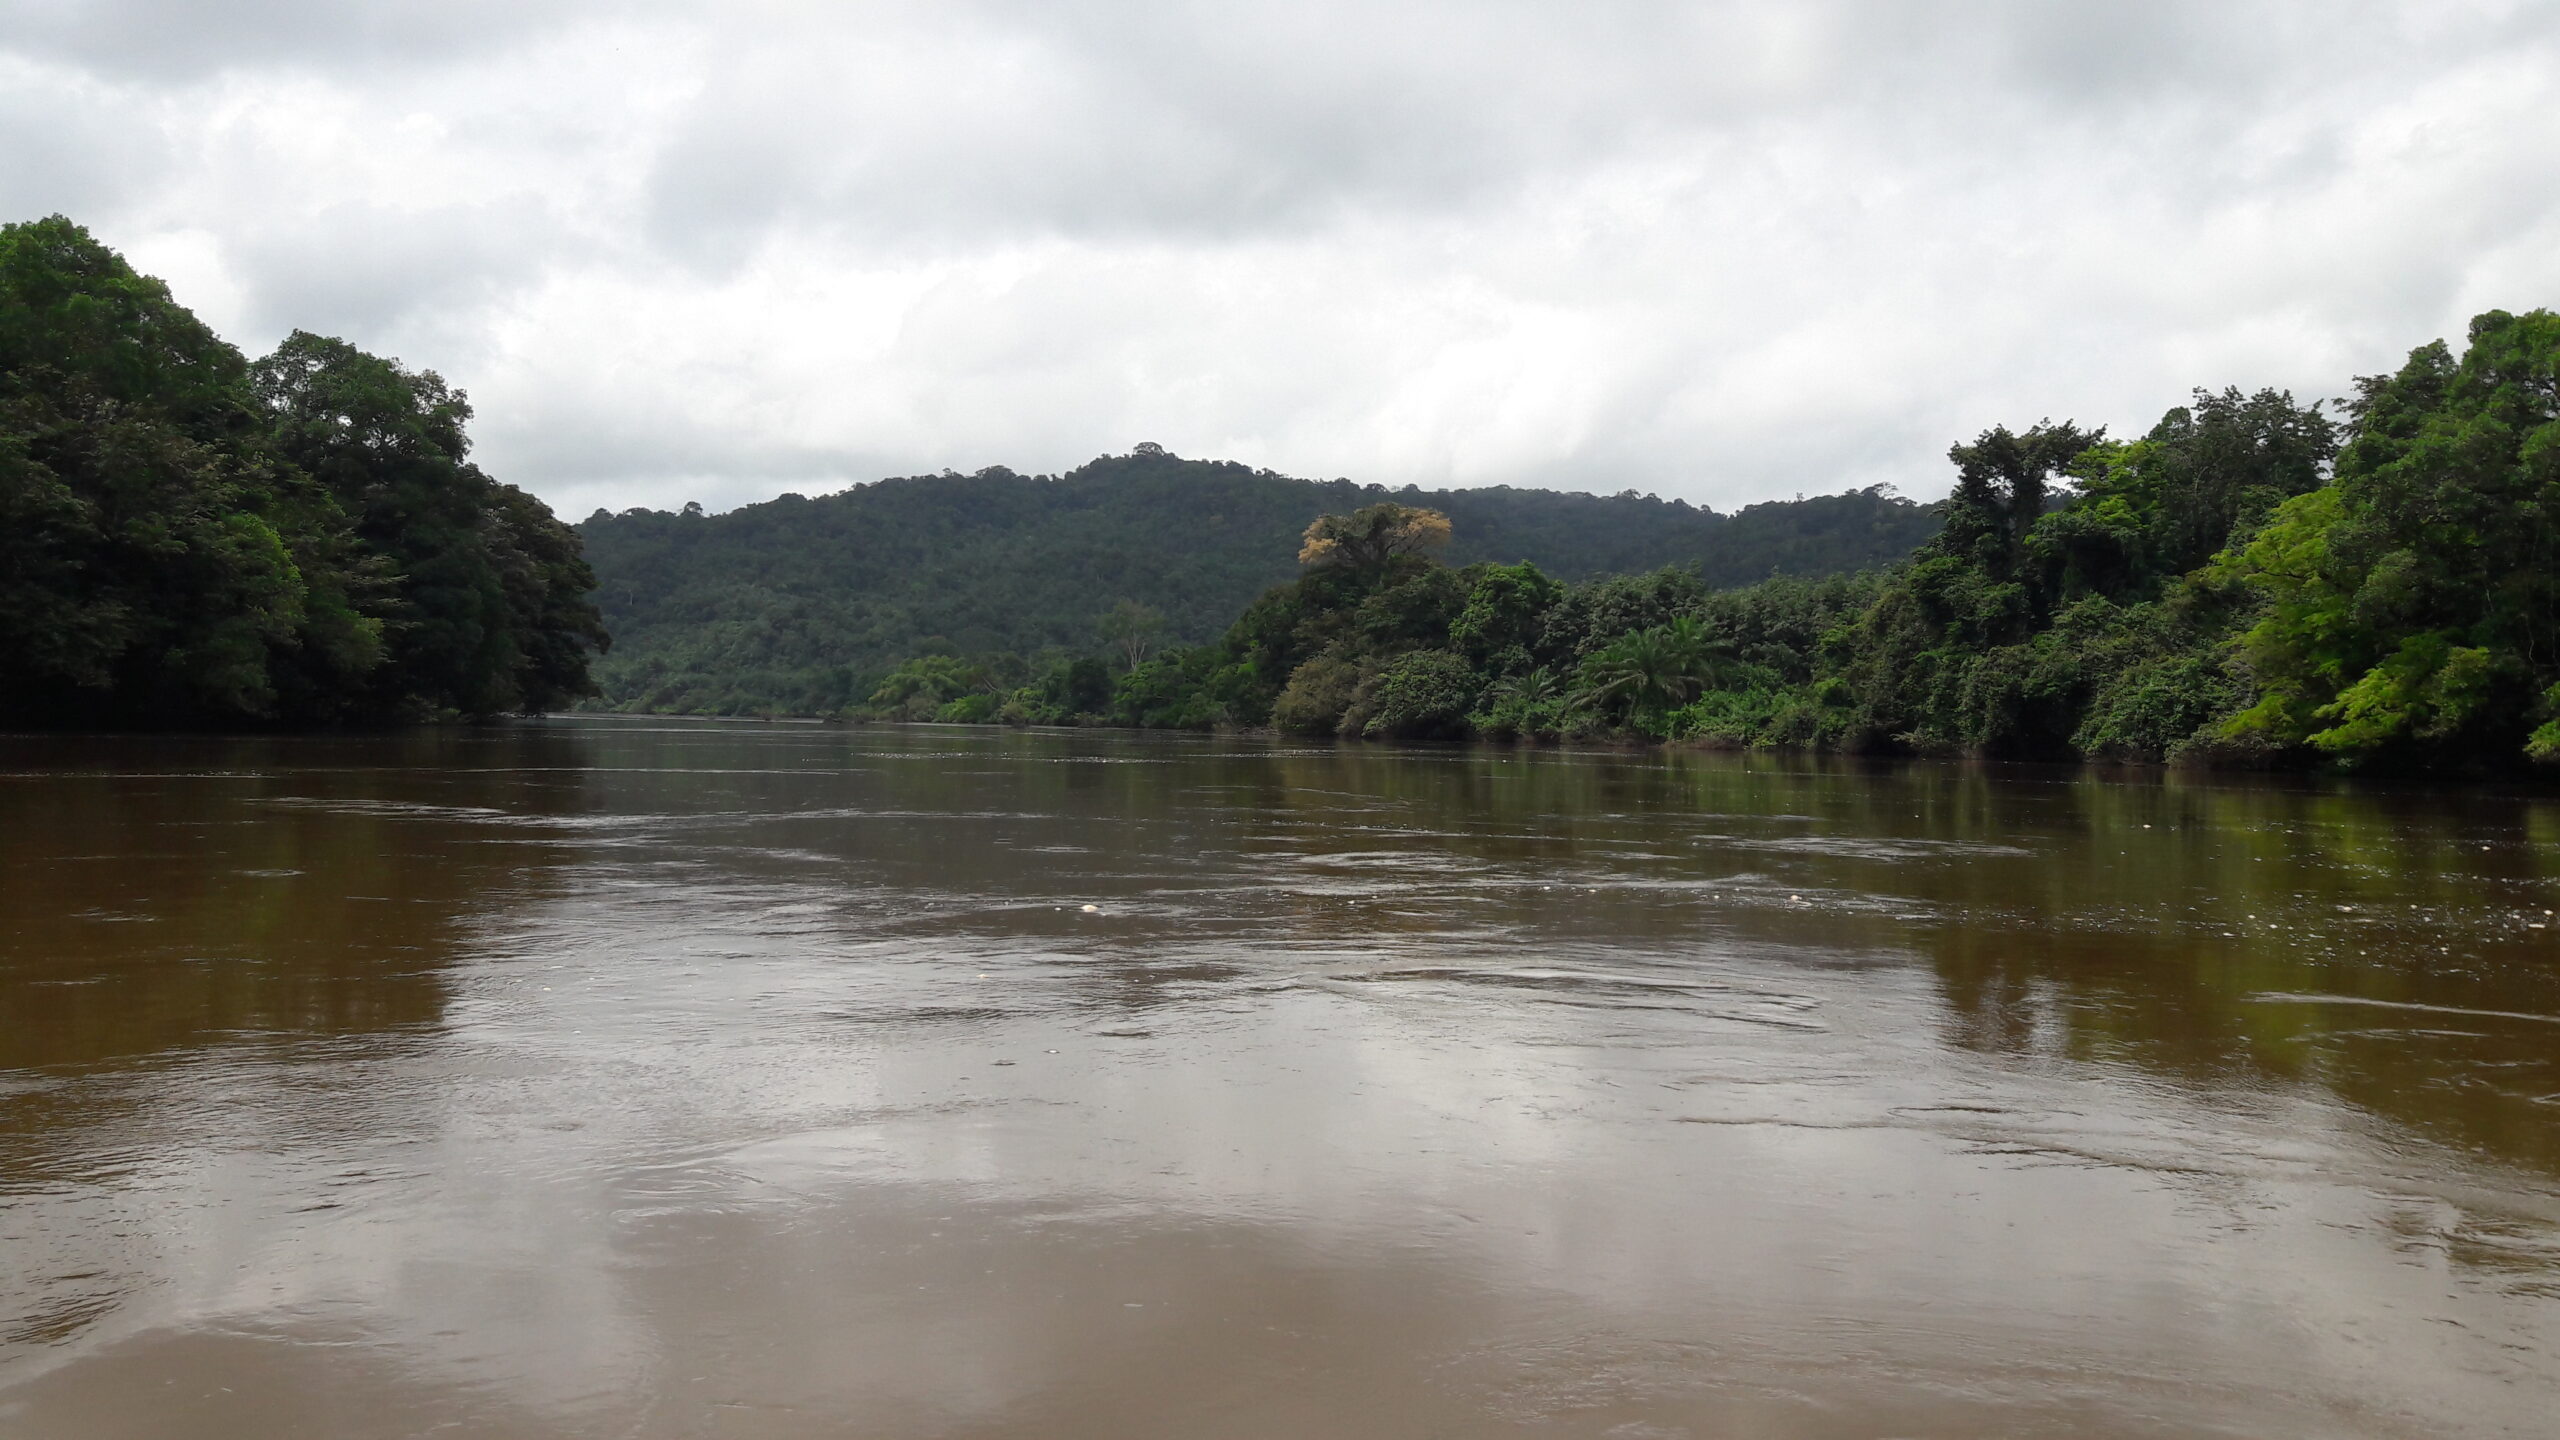
St. John River at Mt. Finlay
| Area | 15723 km2 |
| Stream Length | 424 km |
| Start Date | 9/4/2013 |
| End Date | 22-01-2026 |
| Mean Flow | 394.16 m3/s |
| Mean Annual Catchment Runoff | 791 mm |
| Mean Specific Flow | 25 l/skm2 |
| Minimum daily flow | 13.91 m3/s, 30-03-2019 |
| Maximum daily flow | 2101.36 m3/s, 17-09-2017 |
| Water Year | May to April |
data explorer
station facts
data download
gallery
annual
monthly
daily
St. John River at Mt. Finlay
Average annual streamflow (m3/s)
(m3/s)
water year (may to april)
difference from mean annual streamflow (m3/s)
(m3/s)
water year (may to april)
mean monthly streamflow (m3/s)
(m3/s)
water year (may to april)
percentage of mean annual flow volume (%)
(%)
water year (may to april)
average daily streamflow (m3/s)
(m3/s)
daily flow duration curve (m3/s)
(m3/s)
St. John River at Mt. Finlay
| Basin | 06 Saint John |
| River | Saint John |
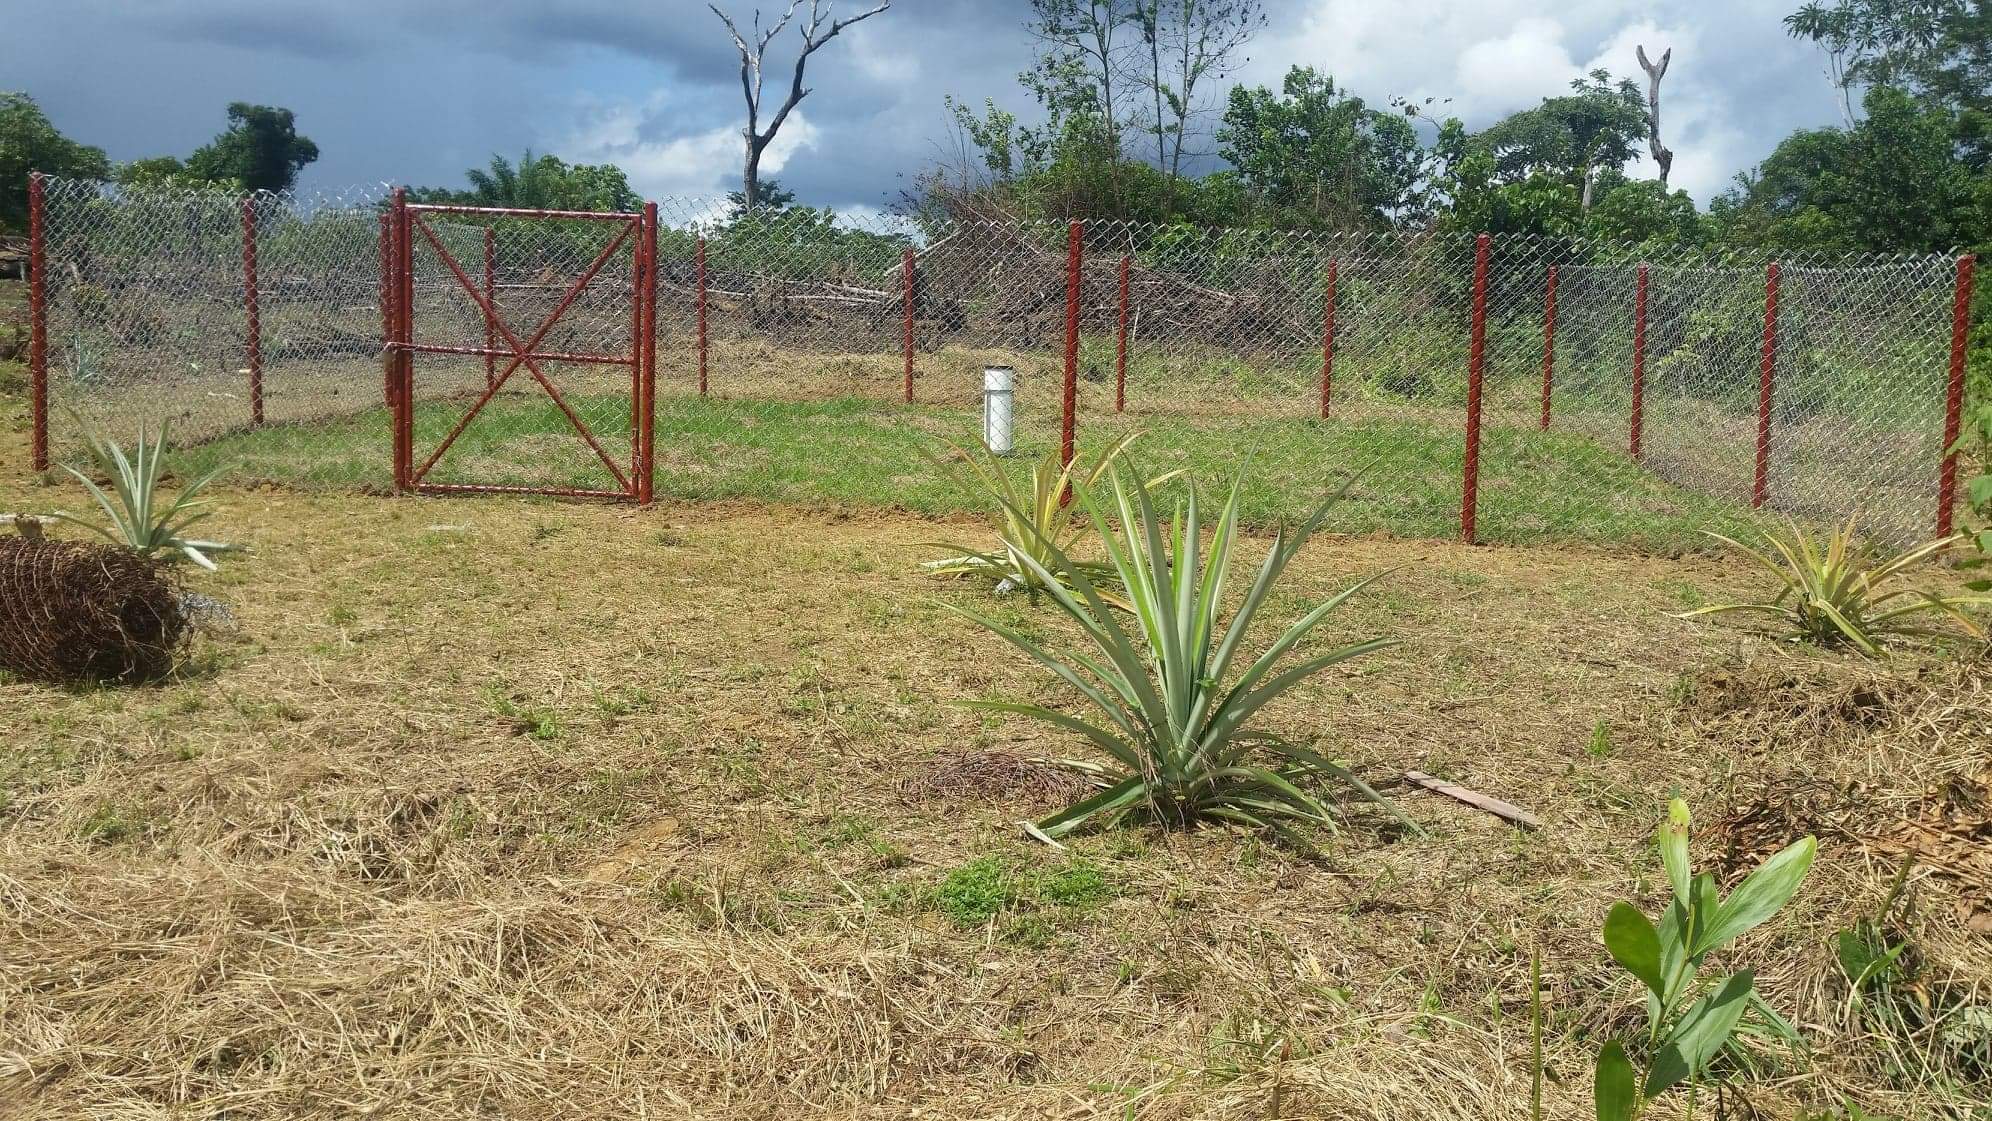
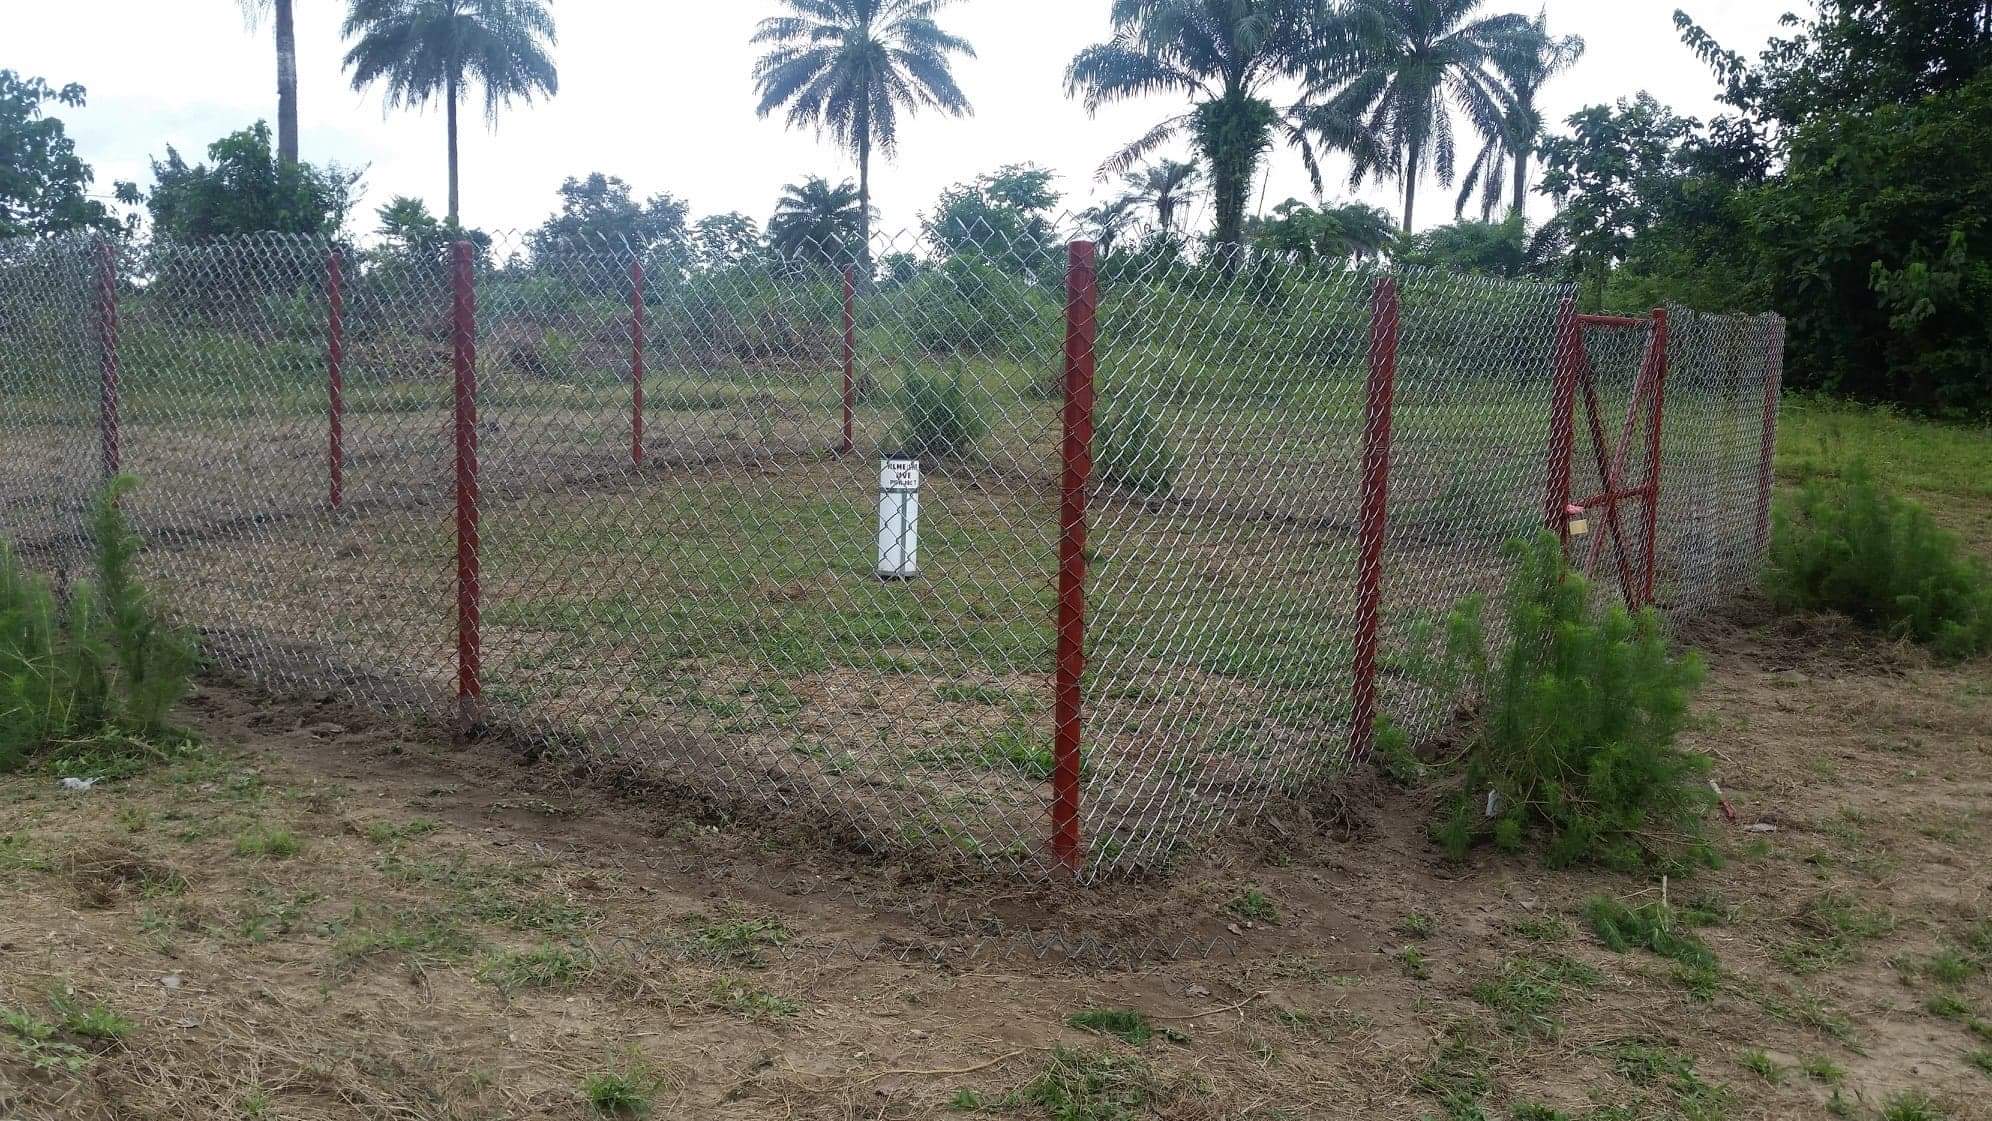
| Station | Mt. Finlay |
| LHS ID | 06SJ002 |
| Location | 9.87 °N 6.084 °W |
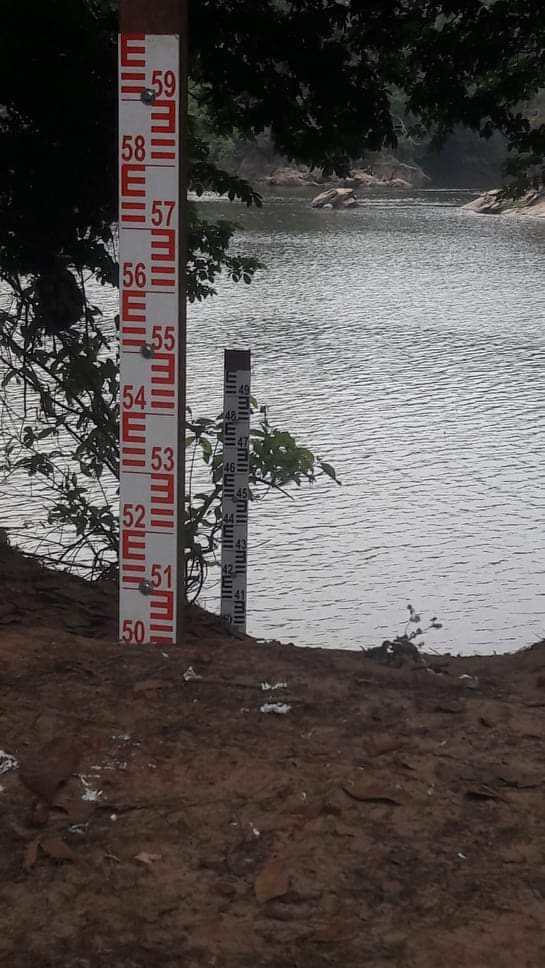
| Gauge | Manual staff gauge, additional OTT Orpheus Mini pressure sensor |
| Rating Curve | 40 flow measurements within the range 25m3/s to 1090m3/s |
| Area | 15723 km2 |
| Stream Length | 424 km |
| Max elevation | 1730 m |
| Min elevation | 65m |
| Start Date | 9/4/2013 |
| End Date | 22-01-2026 |
| Mean Annual Catchment Runoff | 791 mm |
| Mean Specific Flow | 25 l/skm2 |
| Water Year | May to April |
To download data please fill in the fields below